
Visualising Data
Visualising data is quite a challenge. The range of tasks, challenges and target audience varies widely. Nevertheless, the graphic preparation of the research data is a good way to interpret and communicate your own results during and after your research. This can take place in a wide variety of forms, such as diagrams, organizational charts, animations, etc.
The selection of visualization methods always depends on your own research area and the question for which the data were collected. In the following you can find some examples and further literature references that can help you visualize your data.
Examples of Data Visualization
Here are various visual representations of visualisations. There are almost infinite possibilities to visualise your own research data. Therefore, these examples are only intended as a small suggestion.
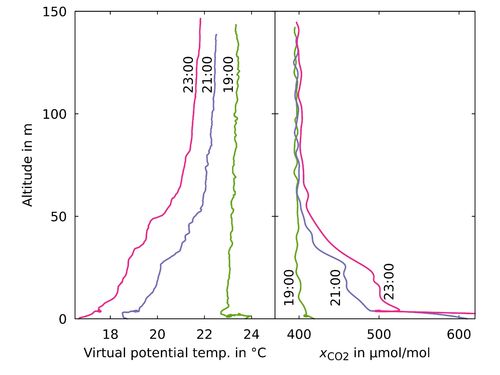
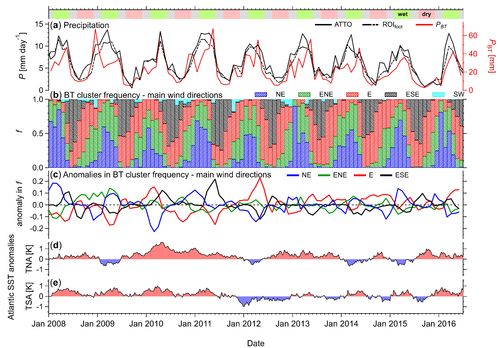
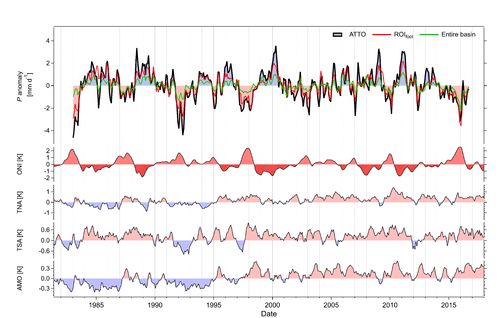
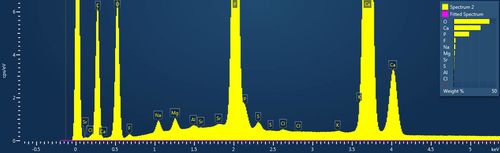
Examples of Data Graphs
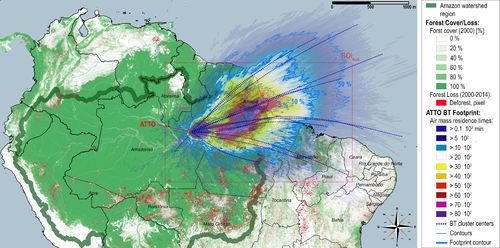
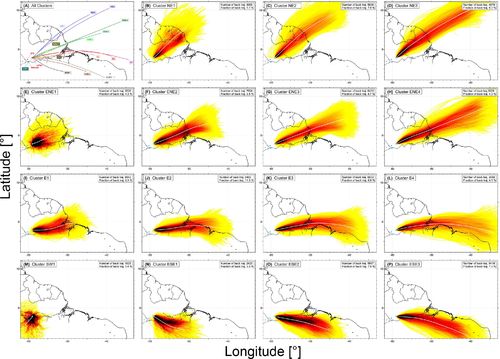
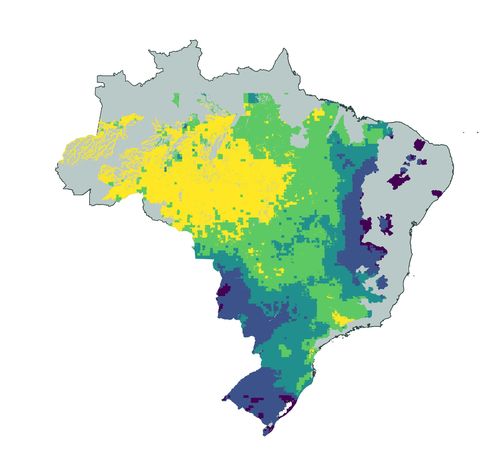
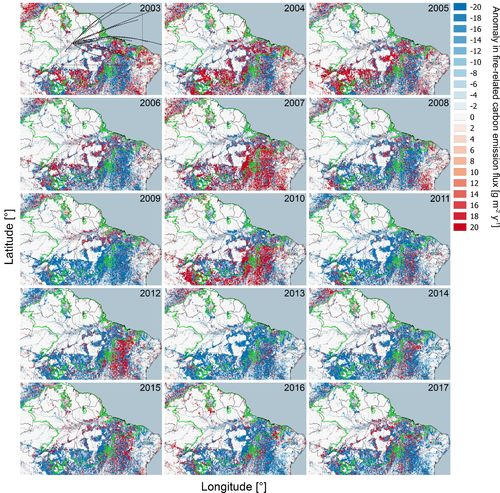
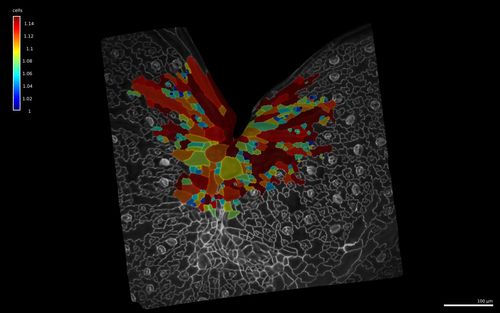
Examples of Data Maps
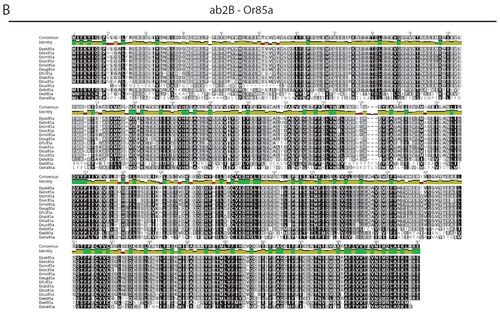
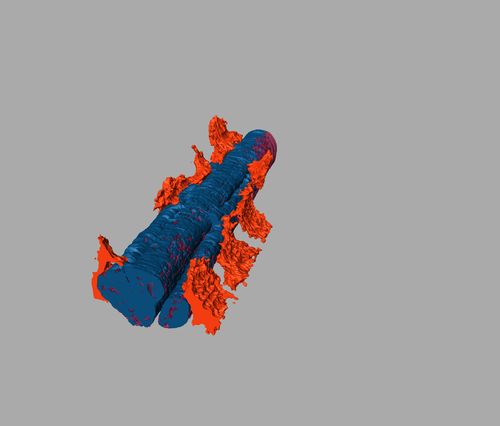
Examples of Sequences and 3D Data Systems

Examples of Tools for Data Visualization
| Tool Name | Short Explanation | Link |
|---|---|---|
| Adobe Creative Cloud | Adobe products offer applications with functions for graphical, web, and image design, video and audio editing; centrally licensed for MPG via MPDL SoLi. | www.soli.mpdl.mpg.de/en/software/adobe/ |
| Affinity Designer, Publisher and Photo | Affinity offers graphics, drawing and image editing programms; centrally licensed for MPG via MPDL SoLi. | www.soli.mpdl.mpg.de/en/software/affinity/ |
| BioRender | An online tool that helps scientists to create and share professional science figures; centrally licensed for MPG via MPDL SoLi. | https://app.biorender.com/mpg |
| CLARIAH-DE: Analysing and Processing Data | Finding Tools for Data-based Analyses | www.clariah.de/en/analysis-processing |
| DARIAH-DE Geo-Browser | This tools allows a comparative visualization with correlations of geographic spatial relations and corresponding time sequences. | https://de.dariah.eu/en/web/guest/geobrowser |
| Datasheet Editor | Datasheet Editor to prepare and setup your data to be visualized within the DARIAH-DE Geo-Browser. | https://geobrowser.de.dariah.eu/edit/ |
| Datawrapper | Commercial online tool for visualizing data in a low-threshold manner. | www.datawrapper.de |
| D3 Data-Driven Documents (D3.js) | JavaScript library for manipulating documents based on data, with powerful visualization components and a data-driven approach to DOM manipulation. | https://d3js.org/ |
| Grafana Analytic Plattform | Commerical analytics platform for all metrics with many visualisation tools. | wwww.grafana.com/grafana |
| Google Charts | Commercial service provider with many visualisation options for data. | https://developers.google.com/chart |
| hdlab at Stanford University | Different open source tools for research and visualizations. | https://hdlab.stanford.edu/tools/ |
| ImageJ | Open Source software, written in Java, for visualising data. | https://imagej.nih.gov/ij/ |
| Maple | Maple is an application for analytical solutions and equations as well as symbolic computations and data visualization; centrally licensed for MPG via MPDL SoLi. | www.soli.mpdl.mpg.de/en/software/maple/ |
| Mathematica | Mathematica offers functions for solving tasks from engineering, financial and actuarial mathematics, mathematics, statistics, physics, chemical computing, and the natural sciences; centrally licensed for MPG via MPDL SoLi. | www.soli.mpdl.mpg.de/en/software/mathematica/ |
| MatLab | MatLab is a numeric computing environment; centrally licensed for MPG via MPDL SoLi. | www.soli.mpdl.mpg.de/en/software/matlab/ |
| Open Knowledge Foundation Germany: Open Data Tools | Tools to explore, publish and share public datasets. | www.opendata-tools.org |
| OpenLayers | Open Source software for visualising spatial data. | www.openlayers.org |
| OpenMicroscopy | Software for reading proprietary microscopy image data and metadata. | www.openmicroscopy.org/bio-formats |
| Polymaps | A JavaScript library for image- and vector-tiled maps using SVG. | www.polymaps.org |
Design Texts about Data Visualization
D. McCandless: Information is Beautiful, https://informationisbeautiful.net/about/.
Web Designer Depot (2009): 50 Great Examples of Data Visualization, www.webdesignerdepot.com/2009/06/50-great-examples-of-data-visualization/.
Overview on Data Visualising Software by Capterra: www.capterra.com.de/directory/30696/data-visualization/software.
Steve Vertovec, Data Visualization (MPI MMG): http://media.mmg.mpg.de/.
Further Reading on Data Visualization
B. Berendt, J. Vanschoren, B. Gao (2011): Datenanalyse und -visualisierung, In: Handbuch Forschungsdatenmanagement, edit. by S. Büttner, H.-C. Hobohm, L. Müller, Bock + Herchen Verlag, pp. 139–48.
J. Hilden, J. Koponen (2019): Data Visualization Handbook, Aalto University, Helsinki & Espoo.
Nazemi, K., Kaupp, L., Burkhardt, D., & Below, N. (2021). Datenvisualisierung. In M. Putnings, H. Neuroth, & J. Neumann (Eds.), Praxishandbuch Forschungsdatenmanagement (pp. 477–502). De Gruyter Saur. doi:10.1515/9783110657807-026.
I. Meirelles (2013): Design for Information: An Introduction to the Histories, Theories, and Best Practices Behind Effective Information Visualizations, Rockport Publishers.
S. Murray (2017): Interactive Data Visualization for the Web: An Introduction to Designing with D3, O’Reilly Media, 2nd edition.
C. Schmied and HK Jambor (2021): Effective image visualization for publications – a workflow using open access tools and concepts, in: F1000Research, 9:1373, doi:10.12688/f1000research.27140.2.
E. R. Tufte (2001): The Visual Display of Quantitative Information, Graphics Press, 2nd edition.
C. Ware (2012): Information Visualization: Perception for Design, Morgan Kaufmann by Elsevier, 3rd edition.
N. Yau (2011): Visualize This: The Flowing Data Guide to Design, Visualization, and Statistics, Wiley.